

How Many Miles Do Americans Drive Each Year?
 Written by Dylan Tate Written by Dylan Tate Dylan TateDylan Tate is an insurance content expert for SmartFinancial with over 300 articles about home, auto, business, health a... Read more |  Edited by Richard Murphy Edited by Richard MurphyRichard MurphyRichard Murphy manages content on SmartFinancial's website. With a strong background in content strategy and copywriting... Read more |
 Editorial Standards
 SmartFinancial Offers Unbiased, Fact-based Information. Our fact-checked articles are intended to educate insurance shoppers so they can make the right buying decisions. Learn More
The average licensed driver in the United States drives approximately 7,500 miles per year, according to the most recent data from the Department of Transportation’s Federal Highway Administration (FHWA). Several factors can impact the average miles driven per year by any given person, including location, age and sex.
Keep reading for a closer look at annual driving habits — and how your mileage could influence what you pay for car insurance.
|
Key Takeaways
|


Average Miles Driven per Year by State
Americans drove an average of 7,512 miles in 2023, according to data from the Federal Highway Administration.[1][2] However, this figure can vary widely by state.
The table below shows the average annual mileage per licensed driver in each state. The number is calculated by dividing the total miles driven in a state by the number of licensed drivers living there.[1][2]
|
State/District |
Average Annual Mileage per Driver |
|---|---|
|
Alabama |
7,856 |
|
Alaska |
5,489 |
|
Arizona |
6,186 |
|
Arkansas |
8,459 |
|
California |
7,680 |
|
Colorado |
7,713 |
|
Connecticut |
7,133 |
|
Delaware |
6,126 |
|
District of Columbia |
3,476 |
|
Florida |
7,204 |
|
Georgia |
8,338 |
|
Hawaii |
5,055 |
|
Idaho |
6,664 |
|
Illinois |
6,656 |
|
Indiana |
6,413 |
|
Iowa |
7,899 |
|
Kansas |
7,972 |
|
Kentucky |
8,770 |
|
Louisiana |
8,627 |
|
Maine |
5,849 |
|
Maryland |
8,305 |
|
Massachusetts |
7,309 |
|
Michigan |
6,716 |
|
Minnesota |
6,864 |
|
Mississippi |
9,874 |
|
Missouri |
9,884 |
|
Montana |
8,485 |
|
Nebraska |
7,867 |
|
Nevada |
6,190 |
|
New Hampshire |
6,717 |
|
New Jersey |
6,944 |
|
New Mexico |
8,926 |
|
New York |
5,427 |
|
North Carolina |
7,141 |
|
North Dakota |
9,192 |
|
Ohio |
6,655 |
|
Oklahoma |
8,884 |
|
Oregon |
6,771 |
|
Pennsylvania |
6,155 |
|
Rhode Island |
6,820 |
|
South Carolina |
7,976 |
|
South Dakota |
8,632 |
|
Tennessee |
8,994 |
|
Texas |
9,448 |
|
Utah |
9,208 |
|
Vermont |
5,842 |
|
Virginia |
8,847 |
|
Washington |
6,131 |
|
West Virginia |
7,153 |
|
Wisconsin |
7,869 |
|
Wyoming |
12,421 |
|
National |
7,512 |
States Where People Drive the Most
California drivers logged the most miles in 2023, with residents of the Golden State collectively driving over 213 billion miles. However, because California has such a large population, its average mileage per capita was close to the nationwide average.[1][2]
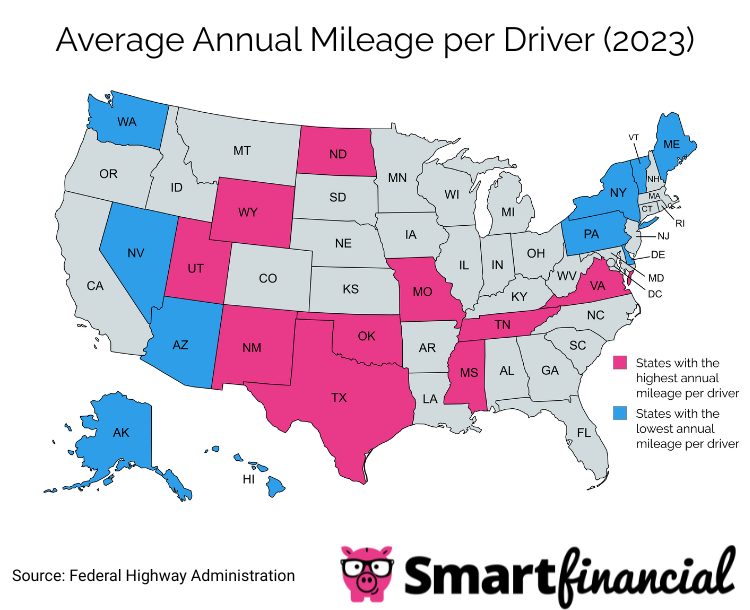
The following states had the highest average miles per licensed driver:[1][2]
- Wyoming: 12,421 miles
- Missouri: 9,884 miles
- Mississippi: 9,874 miles
- Texas: 9,448 miles
- Utah: 9,208 miles
- North Dakota: 9,192 miles
- Tennessee: 8,994 miles
- New Mexico: 8,926 miles
- Oklahoma: 8,884 miles
- Virginia: 8,847 miles
States Where People Drive the Least
Washington, D.C., had the lowest overall mileage in the country in 2023 at 1.8 billion miles, with Vermont having the lowest mileage among states at 2.8 billion miles — likely due to their small populations. The District of Columbia also had the lowest average miles driven per capita, averaging 3,476 miles per licensed driver.[1][2]
Here are the states with the lowest average miles per licensed driver:[1][2]
- Hawaii: 5,055 miles
- New York: 5,427 miles
- Alaska: 5,489 miles
- Vermont: 5,842 miles
- Maine: 5,849 miles
- Delaware: 6,126 miles
- Washington: 6,131 miles
- Pennsylvania: 6,155 miles
- Arizona: 6,186 miles
- Nevada: 6,190 miles
Factors That Determine How Many Miles You Drive
Your location is one of the biggest factors impacting how many miles you drive. For example, people in rural areas may have to drive longer distances to get to their nearest school or grocery store, while people in urban areas with easy access to public transportation may only need to drive sparingly — if at all.
Additionally, societal shifts following the COVID-19 pandemic could contribute to lower mileage for many drivers. For example, 35% of American workers did their jobs remotely instead of driving to an office some or all of the time in 2023 — an increase of more than 10% from 2019.[3] Meanwhile, grocery delivery services have risen in popularity, with Instacart alone reaching more than $35 billion in sales in 2023.[4]
Do Different Demographics Play a Role in Annual Mileage?
The region you live in, how old you are and your sex may all be predictors of how much you will drive. See the following sections for specific insights into how these factors impact average annual mileage.
Regional Trends
There is a bit of a correlation between region and mileage. For example, of the 10 states with the highest mileage, the majority are located in the South or Midwest — and all of them except for North Dakota share a border with another high-mileage state. Conversely, the 10 states with the lowest mileage are mostly concentrated in the West and Northeast, and a little more than half of them share a border with another low-mileage state.[1][2]
Average Annual Car Mileage by Age and Sex
Another FHWA dataset from 2022 shows that average annual miles vary significantly among drivers of different ages and sexes. For example, drivers between the ages of 20 and 64 drive about 85% more than younger and older drivers on average.[5] This could be because teenagers and retirees may not need to drive to work or run other errands — at least not as frequently as drivers aged 20 to 64.
Meanwhile, men drive about 63% more than women. Overall, women over the age of 65 drive fewer miles than any other demographic, while men between the ages of 35 and 54 drive the most.[5] One factor that may contribute to the disparity in driving habits between working-age men and women is the fact that women are far more likely than men to be stay-at-home parents.[6]
What Is the Average Mileage for a Car Before It Maxes Out?
A well-maintained vehicle may last as many as 200,000 miles before it starts to experience major problems. You can generally expect your transmission to last for the entire duration of your car’s lifespan. However, other parts of your vehicle may wear out and need to be replaced more quickly — including your brake pads and engine timing belt.[7]
How Does Annual Mileage Affect Insurance Rates?
The number of miles you drive is one of the biggest factors insurance companies use to calculate your car insurance premiums, along with your location, driving record, personal information, policy details and car’s characteristics.[8] Fortunately, there are numerous options for reducing costs if you are a low-mileage driver.
For example, pay-per-mile car insurance requires you to pay a base premium plus a variable fee based on the number of miles you drive, allowing you to pay less overall if you drive infrequently. Even if you opt for a standard auto insurance policy, you may qualify for a discount if a mobile app or telematics device records that you keep your mileage under a certain threshold — as determined by your insurer.
Is Car Insurance Expensive for Vehicles With High Mileage?
If all other factors are equal, a high-mileage driver will pay more for car insurance than a low-mileage driver.[8] For example, someone who commutes to work five times a week is more likely to get into a car accident than someone who only drives once a week; as a result, an insurer may need to charge the commuting driver more for coverage to offset the increased risk that it will need to pay out a claim.
- Insurance quotes /
- Auto /
- Average Miles Driven Per Year
Dylan Tate is an insurance content expert for SmartFinancial with over 300 articles about home, auto, business, health and life insurance under his belt. He has over nine years of experience writing for online publications, primarily about gaming and esports. In the process, he has become an expert in search engine optimization, news reporting, feature writing and copy editing.


Get a Free Auto Insurance Quote Online Now.
More on Auto Insurance

Looking for Auto Insurance?
Compare rates from dozens of companies in less than 3 minutes.