

What Is the Average Cost of Car Insurance in the US?
 Written by Dylan Tate Written by Dylan Tate Dylan TateDylan Tate is an insurance content expert for SmartFinancial with over 300 articles about home, auto, business, health a... Read more |  Edited by Richard Murphy Edited by Richard MurphyRichard MurphyRichard Murphy manages content on SmartFinancial's website. With a strong background in content strategy and copywriting... Read more |
 Editorial Standards
 SmartFinancial Offers Unbiased, Fact-based Information. Our fact-checked articles are intended to educate insurance shoppers so they can make the right buying decisions. Learn More
The national average cost of car insurance in the United States is over $2,500 per year for full coverage and over $800 per year for minimum coverage. However, several different factors can impact your auto insurance premiums, including where you live, your driving record and other personal information, the make and model of your car and the types of coverage you buy.
Keep reading to learn more about these cost-determining factors, including a breakdown of average auto insurance costs by state and insurance company.
|
Key Takeaways
|
On This Page

How Much Does Car Insurance Cost in the US?
What Is the Average Cost of Car Insurance by Carrier?
Average Cost of Car Insurance by State in the US
Which States Have the Cheapest Car Insurance?
Which States Have the Most Expensive Car Insurance?
How To Shop for the Best Car Insurance Rates
FAQs

How Much Does Car Insurance Cost in the US?
As of August 2025, drivers in the United States pay an average of $2,679 per year for full coverage car insurance and $808 per year for minimum coverage — or monthly premiums of roughly $223 and $67, respectively.[1] Minimum coverage policies only meet your state’s minimum car insurance requirements, while full coverage policies also include comprehensive and collision insurance.
What Factors Determine the Cost of Car Insurance?
In general, factors that affect your likelihood of filing a car insurance claim will influence how much you have to pay for car insurance. Depending on your state, this may include some or all of the following factors:[1]
- Location (e.g., what state and city you live in, whether you park your car on the street or in a locked garage, etc.)
- Driving record (e.g., history of car accidents or moving violations)
- Annual mileage
- Policy details (e.g., coverage types, limits and deductibles)
- Age
- Gender
- Car make and model
- Marital status
- Application of car insurance discounts
- Market factors, like inflation and the costs of parts and labor
- Credit-based insurance score
- Occupation
- Insurance history
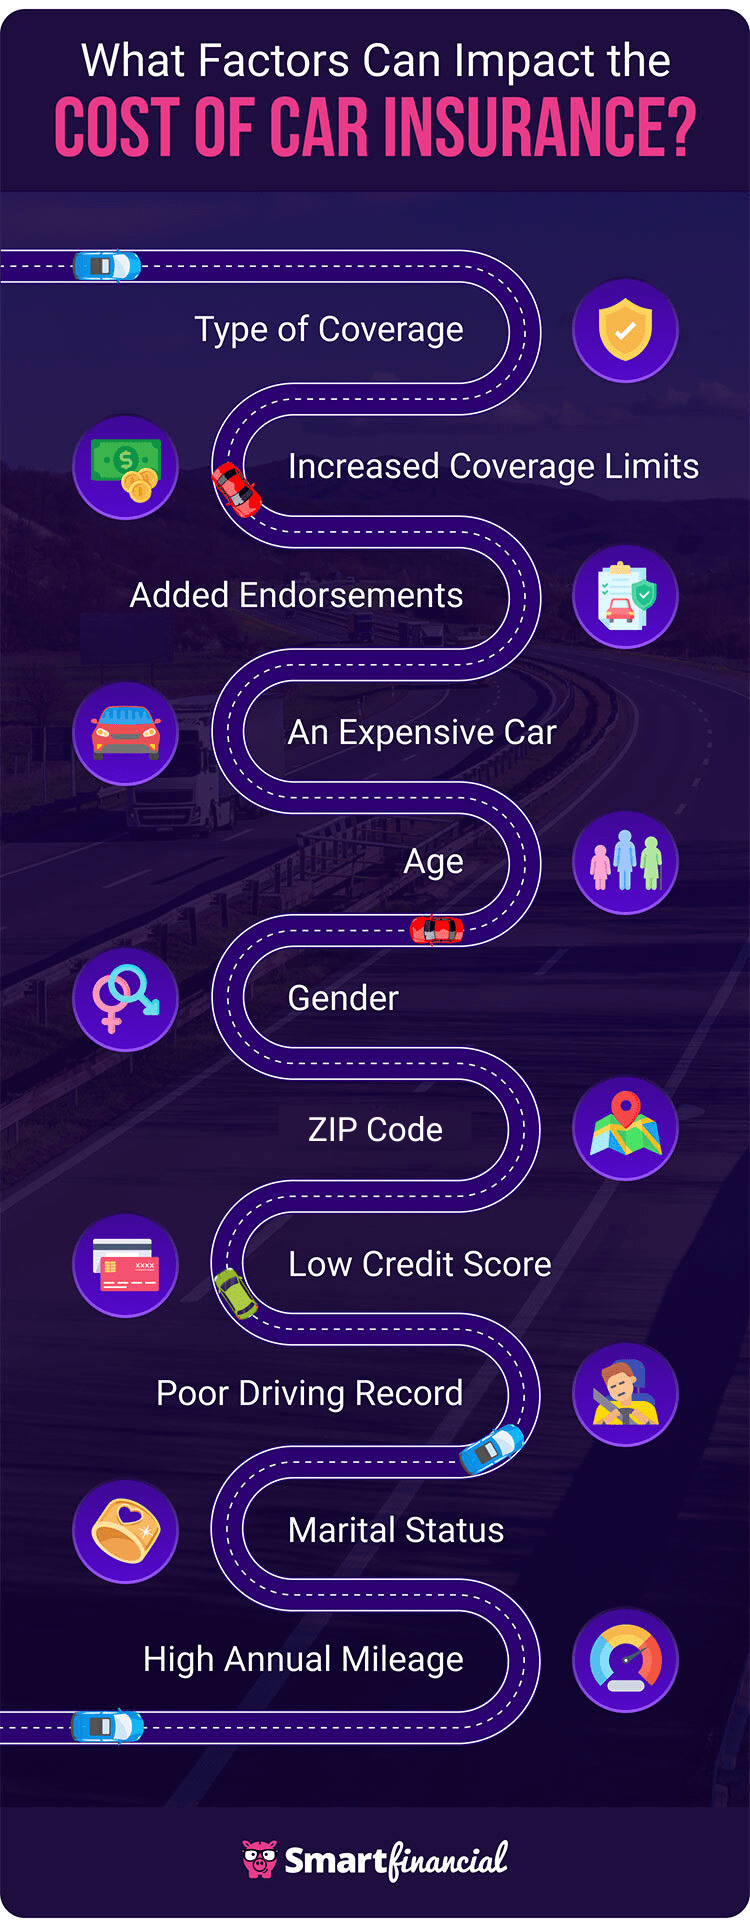
Keep in mind that some states have prohibited or limited the use of certain personal characteristics as auto insurance rating factors. For example, an insurance provider is not allowed to consider your gender or credit score when setting your car insurance premiums in California, Hawaii, Massachusetts or Michigan.[3][4]
To get a more concrete idea of how different factors can affect your auto insurance prices, see the following table, which goes over average rates for drivers with varying credit scores and driving records:[1]
|
Cost-Affecting Factor |
Average Annual Cost of Full Coverage |
|---|---|
|
Excellent credit |
$2,302 |
|
Average credit |
$2,926 |
|
Poor credit |
$4,696 |
|
Good credit and clean driving record |
$2,679 |
|
$3,281 |
|
|
$3,857 |
|
|
Driving under the influence (DUI) conviction |
$5,249 |
What Is the Average Cost of Car Insurance by Carrier?
Since car insurance companies each have their own underwriting methodologies, you will find that different carriers may charge different rates — even for the same level of coverage. Here’s a breakdown of the average cost to insure a car in Newport Beach, California, depending on your insurance carrier:[1]
|
Insurance Company |
Annual Full Coverage Cost |
Annual Minimum Coverage Cost |
|---|---|---|
|
$3,747 |
$1,223 |
|
|
$2,856 |
$815 |
|
|
$2,580 |
$563 |
|
|
$4,579 |
$1,556 |
|
|
$2,394 |
$818 |
|
|
$3,532 |
$983 |
|
|
$3,818 |
$1,010 |
|
|
$3,712 |
$906 |
|
|
$2,582 |
$899 |
Average Cost of Car Insurance by State in the US
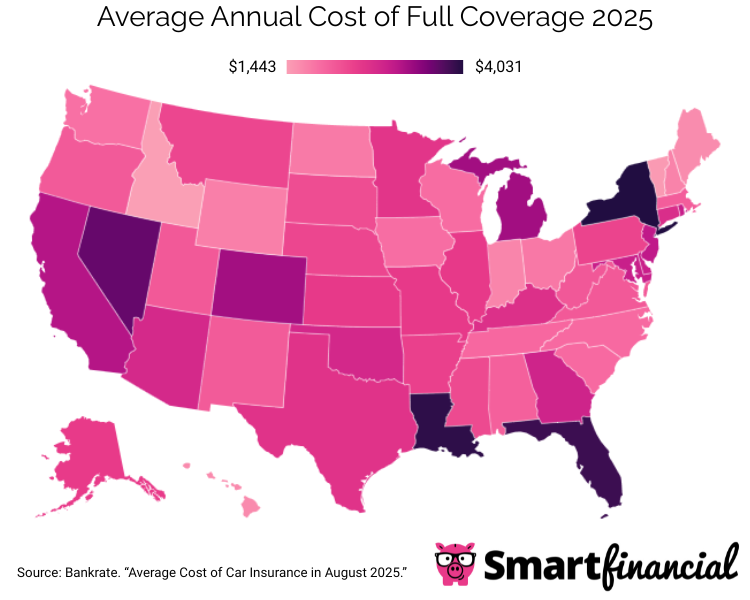
Where you live can directly affect your insurance costs for numerous reasons, including your area’s rate of thefts, accidents and uninsured drivers, as well as your state’s minimum car insurance requirements. For example, drivers in California are required to carry twice as much bodily injury liability coverage and three times as much property damage liability coverage as drivers in Pennsylvania, contributing to California’s higher minimum coverage prices.[5][6]
Below is a breakdown of the average cost of auto insurance across all states and the District of Columbia:[1]
|
State/District |
Annual Full Coverage Cost |
Annual Minimum Coverage Cost |
|---|---|---|
|
Alabama |
$2,059 |
$501 |
|
Alaska |
$2,479 |
$514 |
|
Arizona |
$2,780 |
$822 |
|
Arkansas |
$2,421 |
$496 |
|
California |
$3,102 |
$915 |
|
Colorado |
$3,230 |
$570 |
|
Connecticut |
$2,704 |
$1,057 |
|
Delaware |
$2,931 |
$1,075 |
|
Florida |
$3,874 |
$1,056 |
|
Georgia |
$2,867 |
$1,009 |
|
Hawaii |
$1,650 |
$403 |
|
Idaho |
$1,443 |
$375 |
|
Illinois |
$2,488 |
$688 |
|
Indiana |
$1,704 |
$446 |
|
Iowa |
$1,916 |
$329 |
|
Kansas |
$2,497 |
$579 |
|
Kentucky |
$2,661 |
$736 |
|
Louisiana |
$3,953 |
$1,014 |
|
Maine |
$1,631 |
$418 |
|
Maryland |
$2,946 |
$1,057 |
|
Massachusetts |
$2,095 |
$724 |
|
Michigan |
$3,236 |
$903 |
|
Minnesota |
$2,568 |
$717 |
|
Mississippi |
$2,320 |
$525 |
|
Missouri |
$2,496 |
$635 |
|
Montana |
$2,356 |
$400 |
|
Nebraska |
$2,357 |
$510 |
|
Nevada |
$3,626 |
$1,081 |
|
New Hampshire |
$1,716 |
$459 |
|
New Jersey |
$3,027 |
$1,316 |
|
New Mexico |
$2,126 |
$443 |
|
New York |
$4,031 |
$1,729 |
|
North Carolina |
$1,955 |
$661 |
|
North Dakota |
$1,799 |
$397 |
|
Ohio |
$1,823 |
$487 |
|
Oklahoma |
$2,796 |
$557 |
|
Oregon |
$2,129 |
$881 |
|
Pennsylvania |
$2,386 |
$519 |
|
Rhode Island |
$2,960 |
$916 |
|
South Carolina |
$1,955 |
$625 |
|
South Dakota |
$2,287 |
$370 |
|
Tennessee |
$1,976 |
$501 |
|
Texas |
$2,600 |
$746 |
|
Utah |
$2,146 |
$818 |
|
Vermont |
$1,491 |
$329 |
|
Virginia |
$2,143 |
$762 |
|
Washington |
$1,890 |
$577 |
|
Washington, D.C. |
$2,802 |
$866 |
|
West Virginia |
$2,163 |
$548 |
|
Wisconsin |
$1,924 |
$454 |
|
Wyoming |
$1,760 |
$265 |
Which States Have the Cheapest Car Insurance?
On average, Idaho is the cheapest state for full coverage car insurance as of August 2025. In the following list, you’ll see the average monthly rates for full coverage in the five cheapest states:[1]
- Idaho: $120
- Vermont: $124
- Maine: $136
- Hawaii: $138
- Indiana: $142
Meanwhile, Wyoming drivers enjoy the lowest average premiums for minimum coverage. Average monthly costs for state-mandated coverage in the five cheapest states are as follows:[1]
- Wyoming: $22
- Vermont: $27
- Iowa: $27
- South Dakota: $31
- Idaho: $31
Which States Have the Most Expensive Car Insurance?
Drivers in New York currently have to pay the most for full coverage auto insurance. Monthly full coverage premiums are the highest in the following states on average:[1]
- New York: $336
- Louisiana: $329
- Florida: $323
- Nevada: $302
- Michigan: $270
New York is also the most expensive state for minimum coverage car insurance. While cheaper than full coverage, minimum coverage policies will still cost you a great deal per month in these states:[1]
- New York: $144
- New Jersey: $110
- Nevada: $90
- Delaware: $90
- Connecticut: $88
- Maryland: $88
How To Shop for the Best Car Insurance Rates
It’s good to compare quotes from different auto insurance companies to ensure you get the best deal. Try to get quotes from three to five insurers to determine the best policy for your coverage needs and budget. You’ll need to offer information on your car’s model, along with personal information, such as your age and address — which can become tedious and repetitive to give one at a time.
Fortunately, you can compare rates faster by using an online insurance marketplace, like SmartFinancial. After you answer a few brief questions, we can connect you with a licensed insurance agent who can help you find the perfect policy to fit your needs. Compare car insurance quotes at no cost today!
- Insurance quotes /
- Auto /
- Average Car Insurance Rates
Dylan Tate is an insurance content expert for SmartFinancial with over 300 articles about home, auto, business, health and life insurance under his belt. He has over nine years of experience writing for online publications, primarily about gaming and esports. In the process, he has become an expert in search engine optimization, news reporting, feature writing and copy editing.


Get a Free Auto Insurance Quote Online Now.
More on Auto Insurance

Looking for Auto Insurance?
Compare rates from dozens of companies in less than 3 minutes.